2022 Asset Classes vs Indices
2022 has been a challenging year for investors. Not only have the major indices tested “Bear Market” territory on different occasions but most asset classes have had negative returns. The year has been particularly brutal for bond investors with rising interest rates causing bonds to decline more than stocks. Fortunately, we had a nice “bounce” in October that cut losses across different categories. However, the different stock indices have performed very differently despite “equities” being down 12.7% year to date. How can this be? This brings me to this month’s topic: Indices vs Asset Classes.
Asset Classes
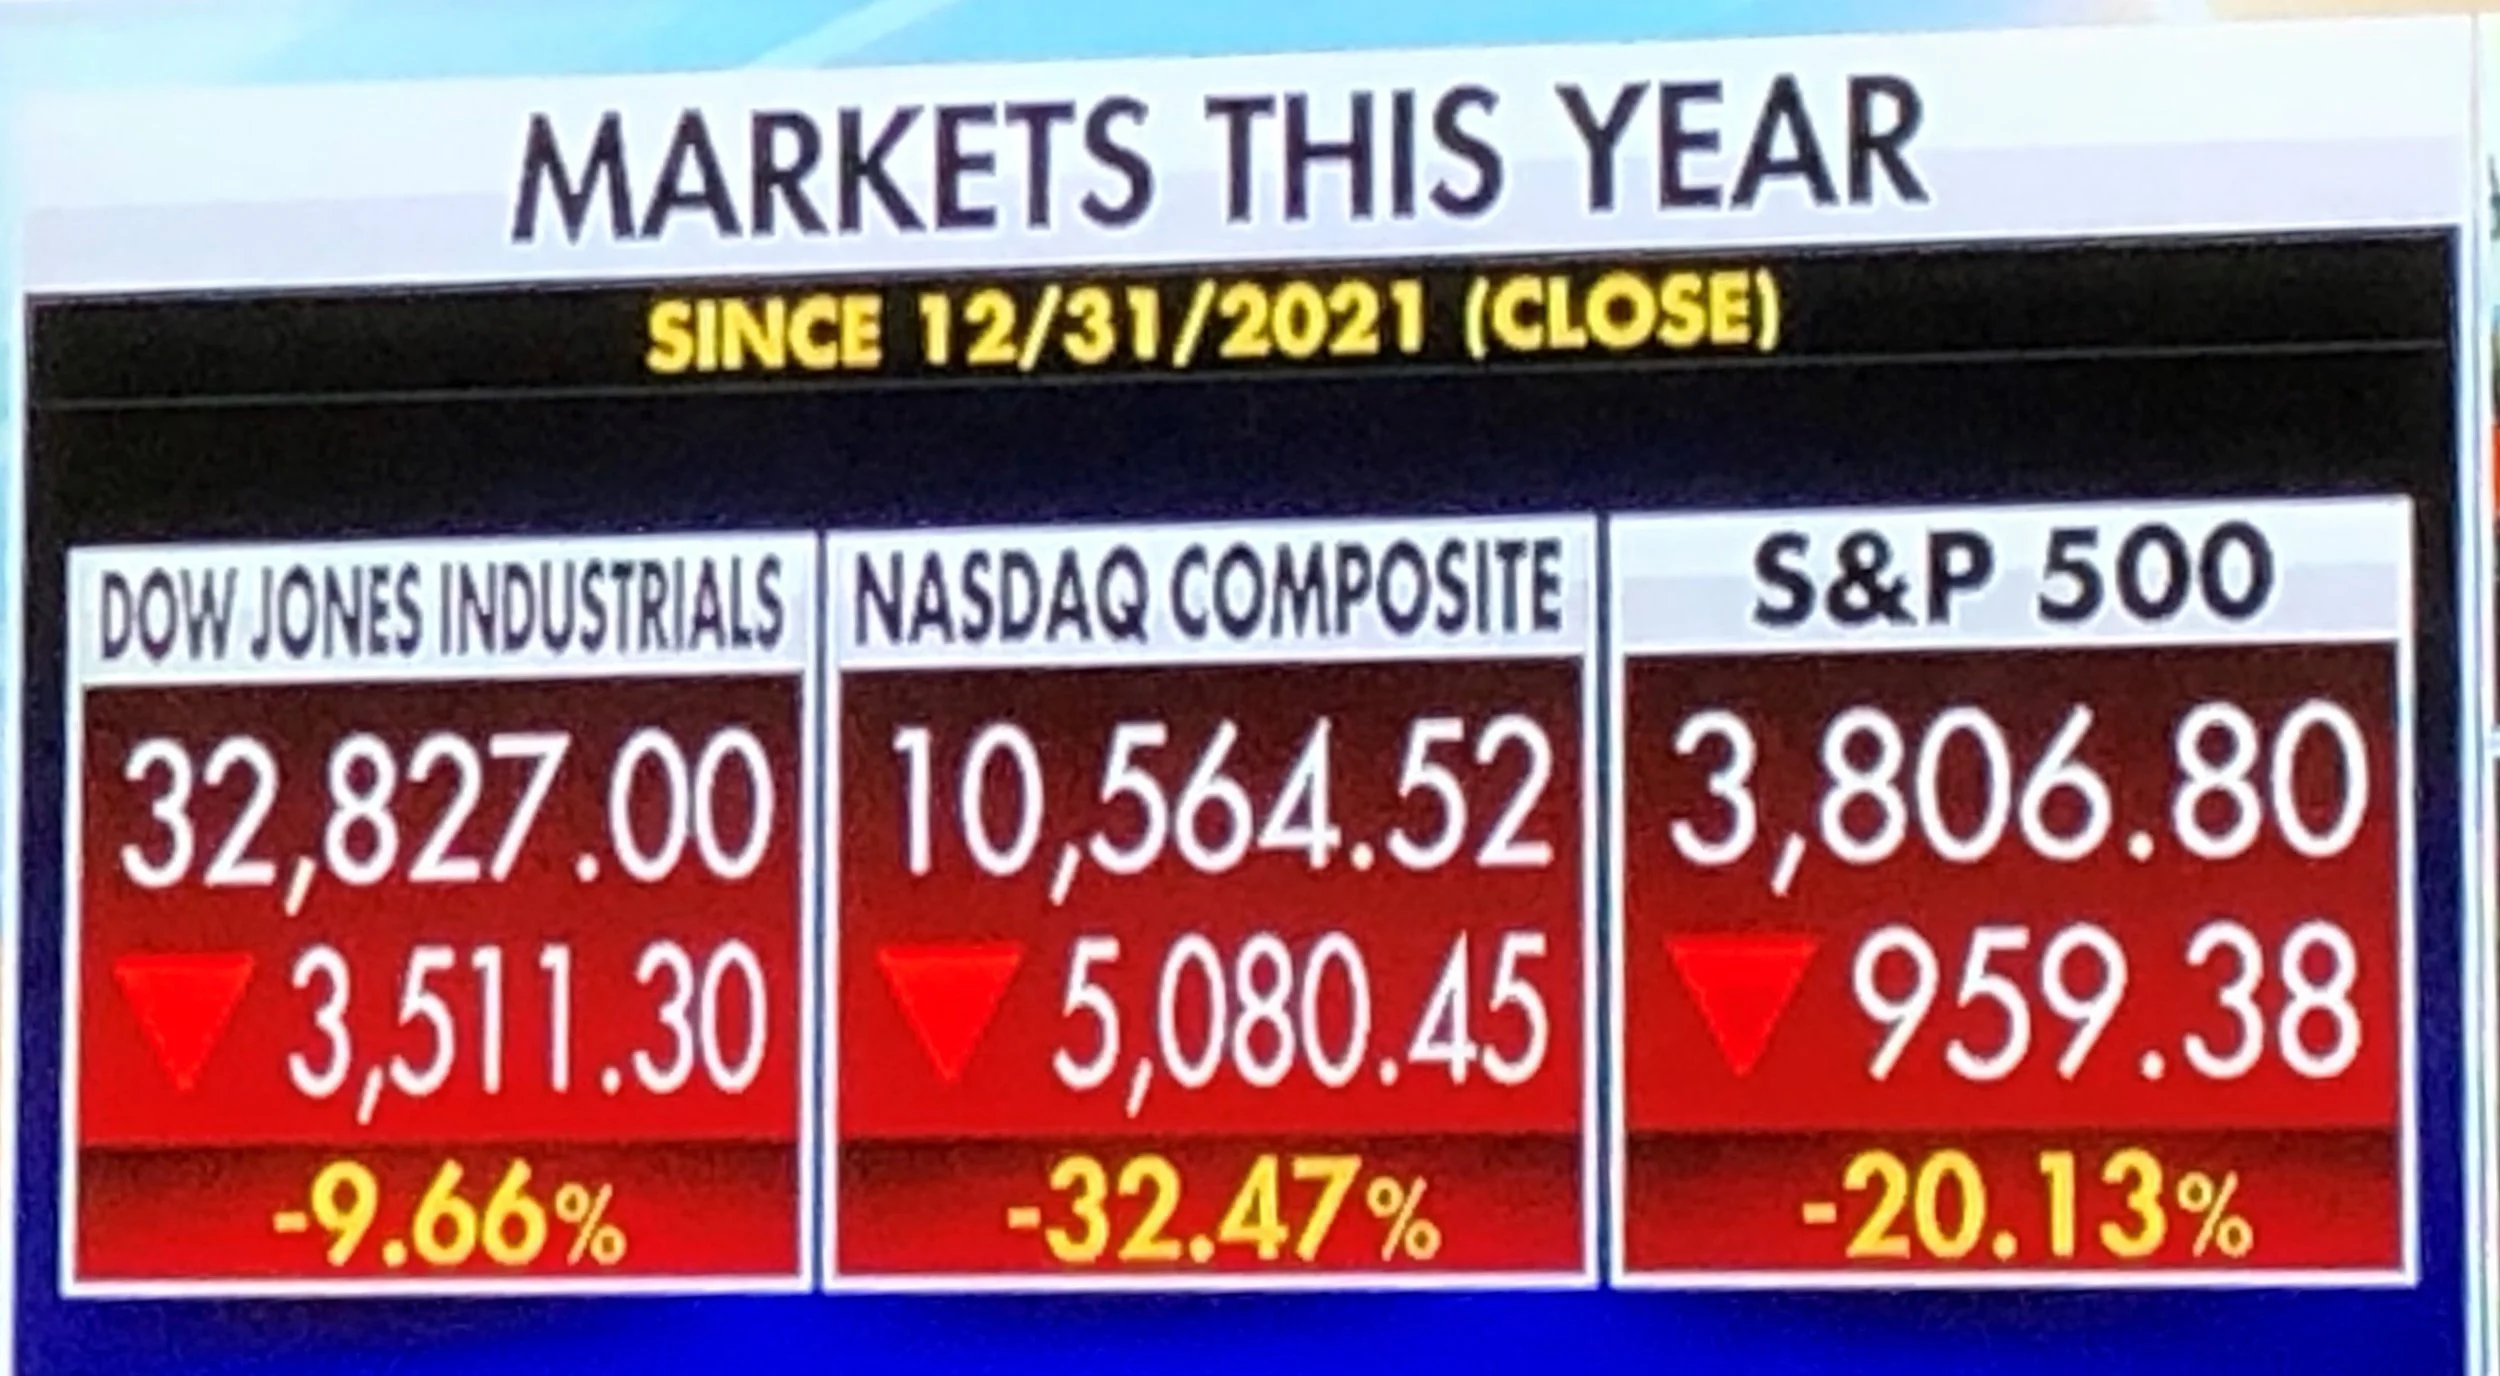
This chart shows a number of standard and alternative asset classes and their year-to-date returns. An asset class is a group of assets that share common qualities and behaviors. They are governed by the same rules and regulations. Different asset classes behave differently, as illustrated above. This is why diversification across asset classes is a tool to minimize risk. However, investors can also diversify within an asset class. According to the above chart “stocks” have yielded -12.7% thus far. However, this does not explain how the DJIA has performed -9.66% YTD, the NASDAQ Composite has performed -32.47%, and the S&P 500 has returned a -20.13% YTD. If all these are “stocks” how have they produced drastically different returns? Answer: stock market sectors.
The same applies within the other asset classes. “Bonds” for example are comprised of government bonds (both federal , local, and municipal) as well as corporate bonds. Within each of those categories are bonds of different durations which also behave very differently.
Indices
Each of the above indices represent different allocations across economic sectors. “Stocks” can be investments in any type and number of companies within different sectors. Therefore, the “-12.7%” return for stocks is simply an average across all economic sectors. Some sectors have performed better than others which is represented by the drastically different performance of the major indices. Each index is comprised of different allocations of the sectors with the DJIA heavy in large industrial companies while the NASDAQ is heavy in technology companies. The S&P 500 simply represents the 500 largest U.S. companies, regardless of sector. This his why each has behaved differently this year. Below are the 11 common market sectors.
These are the 11 GISC Stock market sectors (Global Industry Classification Standard)
Diversification across the sectors also provides risk protection, but the specific allocation (whether across sectors or asset classes) is dependent on the investor’s goals and objectives as well as time horizon and risk capacity. Using the indices as an example, the DJIA is generally more “conservative” in its composition across the sectors while the NASDAQ is more “aggressive” due to its composition of growth oriented technology companies. This explains the 23% difference is returns this year between the two indices. They are both “stock” indices but are composed of very different sectors of stocks.
Diversification
Combining the different asset classes and different sectors based on the investor’s individual circumstances produces the best outcome. One of the simplest ways to diversify is the use of mutual funds and exchange traded funds. All funds have specific objectives and are invested accordingly. Others are simply index funds that mirror the index that they represent and therefore are diversified across the sectors represented in that index. This is why I advocate the use of low-cost funds that match the diversification and investment objectives of my clients. We then combine those funds to further produce a customized allocation. Adding additional positions in individual companies based on value or dividend yield generally rounds out most of my client portfolios.


